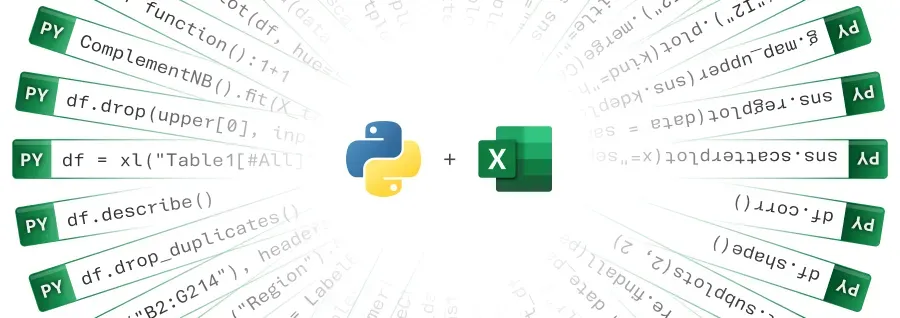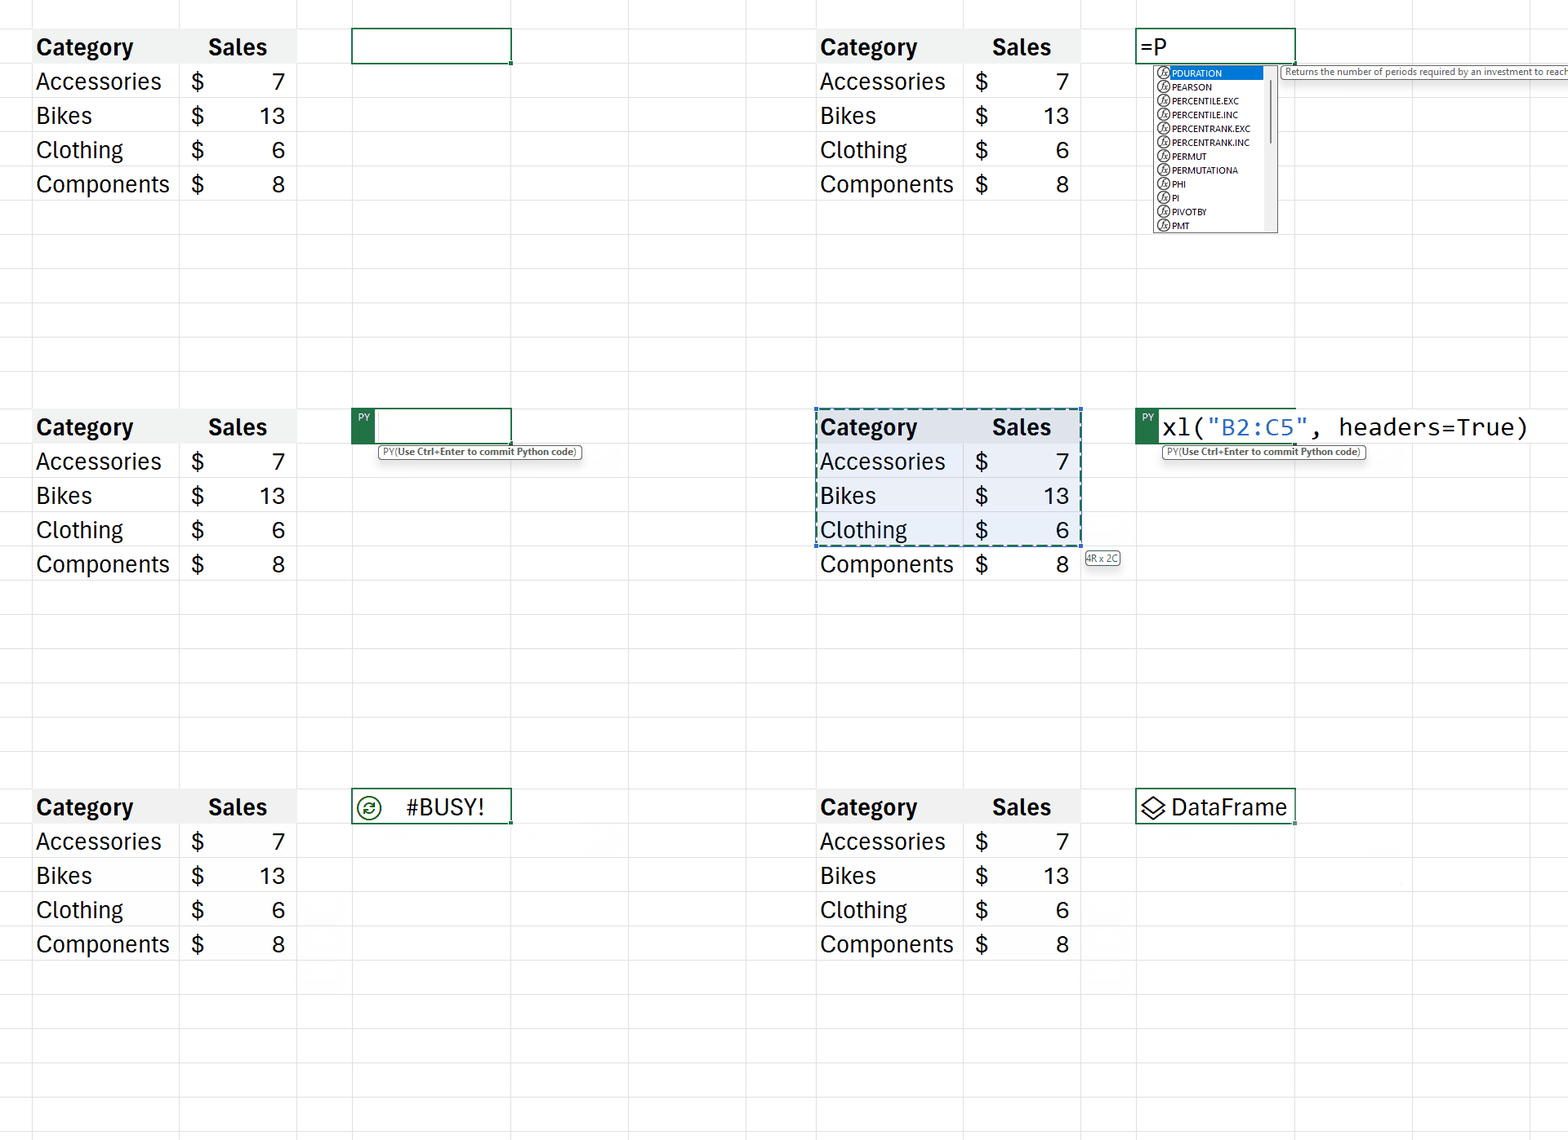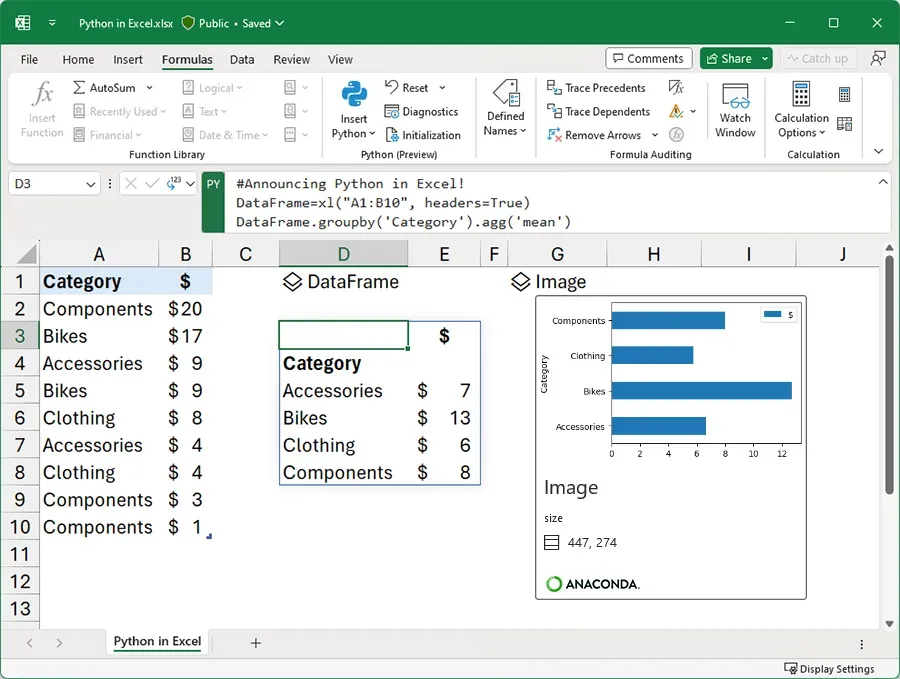
With Python in Excel, users can now write Python code in cells using a new PY function. This Python code will execute securely in the Microsoft Cloud and outputs will be returned back to the Excel worksheet.

Users have access to a wide range of popular Python data science libraries including pandas for data manipulation, Matplotlib for visualization, scikit-learn for machine learning, and statsmodels for statistical modeling. This allows users to perform advanced analysis like visualizing data with charts, applying machine learning algorithms, running predictive analytics, and more - all within Excel using Python.
Python in Excel combines Python's powerful data analysis and visualization libraries with Excel's features you know and love. You can manipulate and explore data in Excel using Python plots and libraries, and then use Excel's formulas, charts, and PivotTables to further refine your insights.
Some examples of new analysis enabled by Python in Excel:
- Creating visualizations like bar charts, line plots, heatmaps, and other advanced charts using Matplotlib and Seaborn libraries.
- Applying machine learning techniques like regression analysis, clustering, random forests, and neural networks using scikit-learn.
- Running time series forecasting and predictive analytics using statsmodels and other libraries.
- Cleaning and transforming data efficiently using pandas and regular expressions.

In a statement, Python creator Guido van Rossum said he is excited about the tight integration between Python and Excel, which he expects will open up new use cases for both communities.
"I am thrilled to announce the integration of Anaconda Distribution for Python into Microsoft Excel – a major breakthrough that will transform the workflow of millions of Excel users around the world,” said Anaconda CEO and co-founder Peter Wang.
Users can easily collaborate on Python-enabled Excel workbooks by sharing with colleagues. The Python code will run for anyone opening the workbook, without requiring Python or any additional setup on their end.
The Python in Excel public preview is now available for Windows Excel beta testers. The feature reflects Microsoft's deep commitment to integrating Python across its products and making it more accessible to Excel's millions of daily users.
Get started with Python in Excel
Python in Excel is rolling out to Public Preview for those in the Microsoft 365 Insiders program Beta Channel. This feature will roll out to Excel for Windows first, starting with build 16818, and then to the other platforms at a later date.
To use Python in Excel, join the Microsoft 365 Insider Program. Choose the Beta Channel Insider level to get the latest builds of the Excel application.
Once you’ve installed the latest Insider build of Excel, open a blank workbook, and take the following steps.
- Select Formulas in the ribbon.
- Select Insert Python.
- Select the Try Preview button in the dialog that appears.
Microsoft plans to make Python in Excel generally available later but will restrict some functionality without a paid license after the preview period. The public preview enables users to start exploring the new data science capabilities Python brings to Excel.